C4 model
A simple and clear way of visualizing a system's architecture
Basic idea
- Created by Simon Brown
- Goal is to provide a simple and clear way of visualizing a system's architecture
- Probably not ideal way to document library, framework or SDK
- Simplified version of concepts found in UML and the 4+1 model for software architecture
- Aims to make it easy for developers to describe how system works
- Aims to minimize the gap between the diagrams and actual code
- How to create?
- Intended to be pretty notation-independent, so can in principle use any diagramming tool
- Dedicated diagramming tool: Structurizr
- Option: use Java/.NET client libraries
- One approach: create model elements imperatively from code
- Other approach: extract software architecture information from code (either based on some rules you define or based on annotations)
- Option: use browser-based workspace editor
- Option: use lightweight Structurizr Express to generate a single diagram with exportable/importable source
- Option: use Java/.NET client libraries
Main concepts
A software system is made up of one or more containers (web applications, mobile apps, desktop applications, databases, file systems, etc), each of which contains one or more components, which in turn are implemented by one or more code elements (e.g. classes, interfaces, objects, functions, etc).
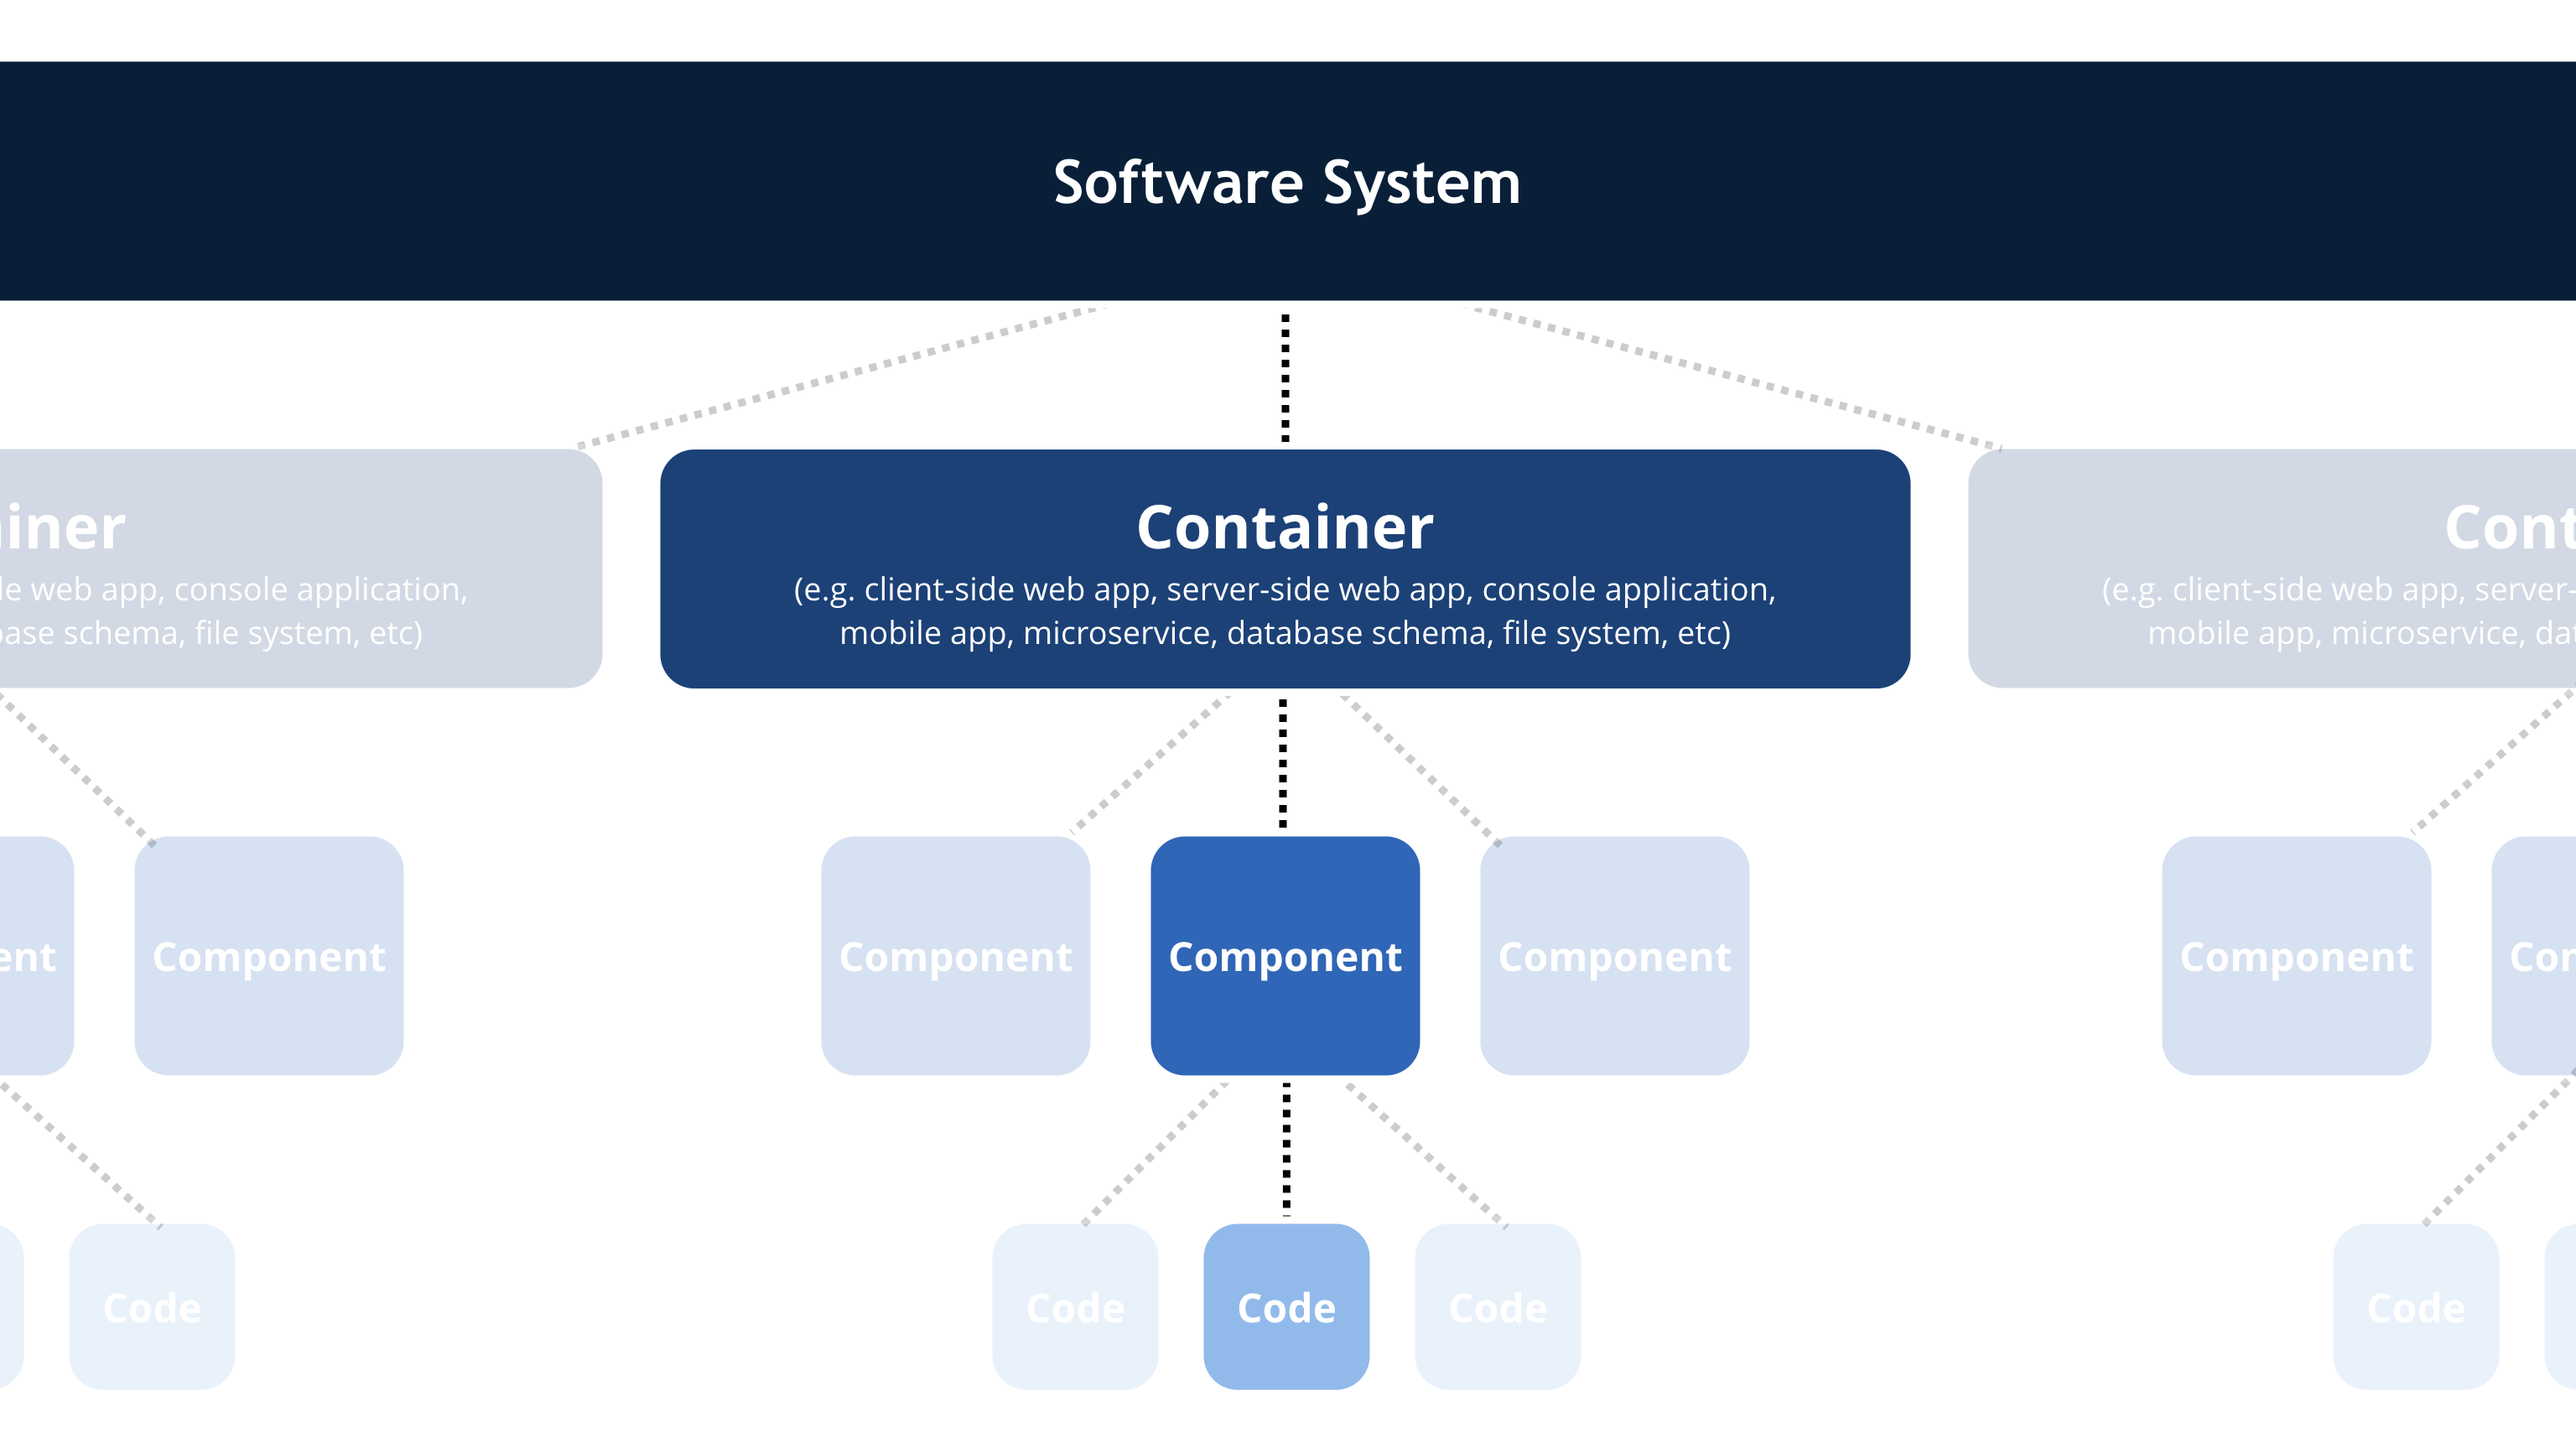
- Person:
- human users of the system
- Software system:
- highest level of abstraction
- describes something that delivers value to its users, whether they are human or not
- Container
- something that hosts code or data
- needs to be running in order for the system to work
- each container is a separately deployable/runnable thing or runtime environment
- communication between containers often rather "expensive" (typically not in same process space)
- examples: server-side web application, client-side web application, mobile app, database, microservice, ...
- Component
- grouping of related functionality encapsulated behind a well-defined interface
- all components inside a container typically execute in the same process space
Core diagrams
Different scope and level of detail (compare to zooming in on Google Maps)
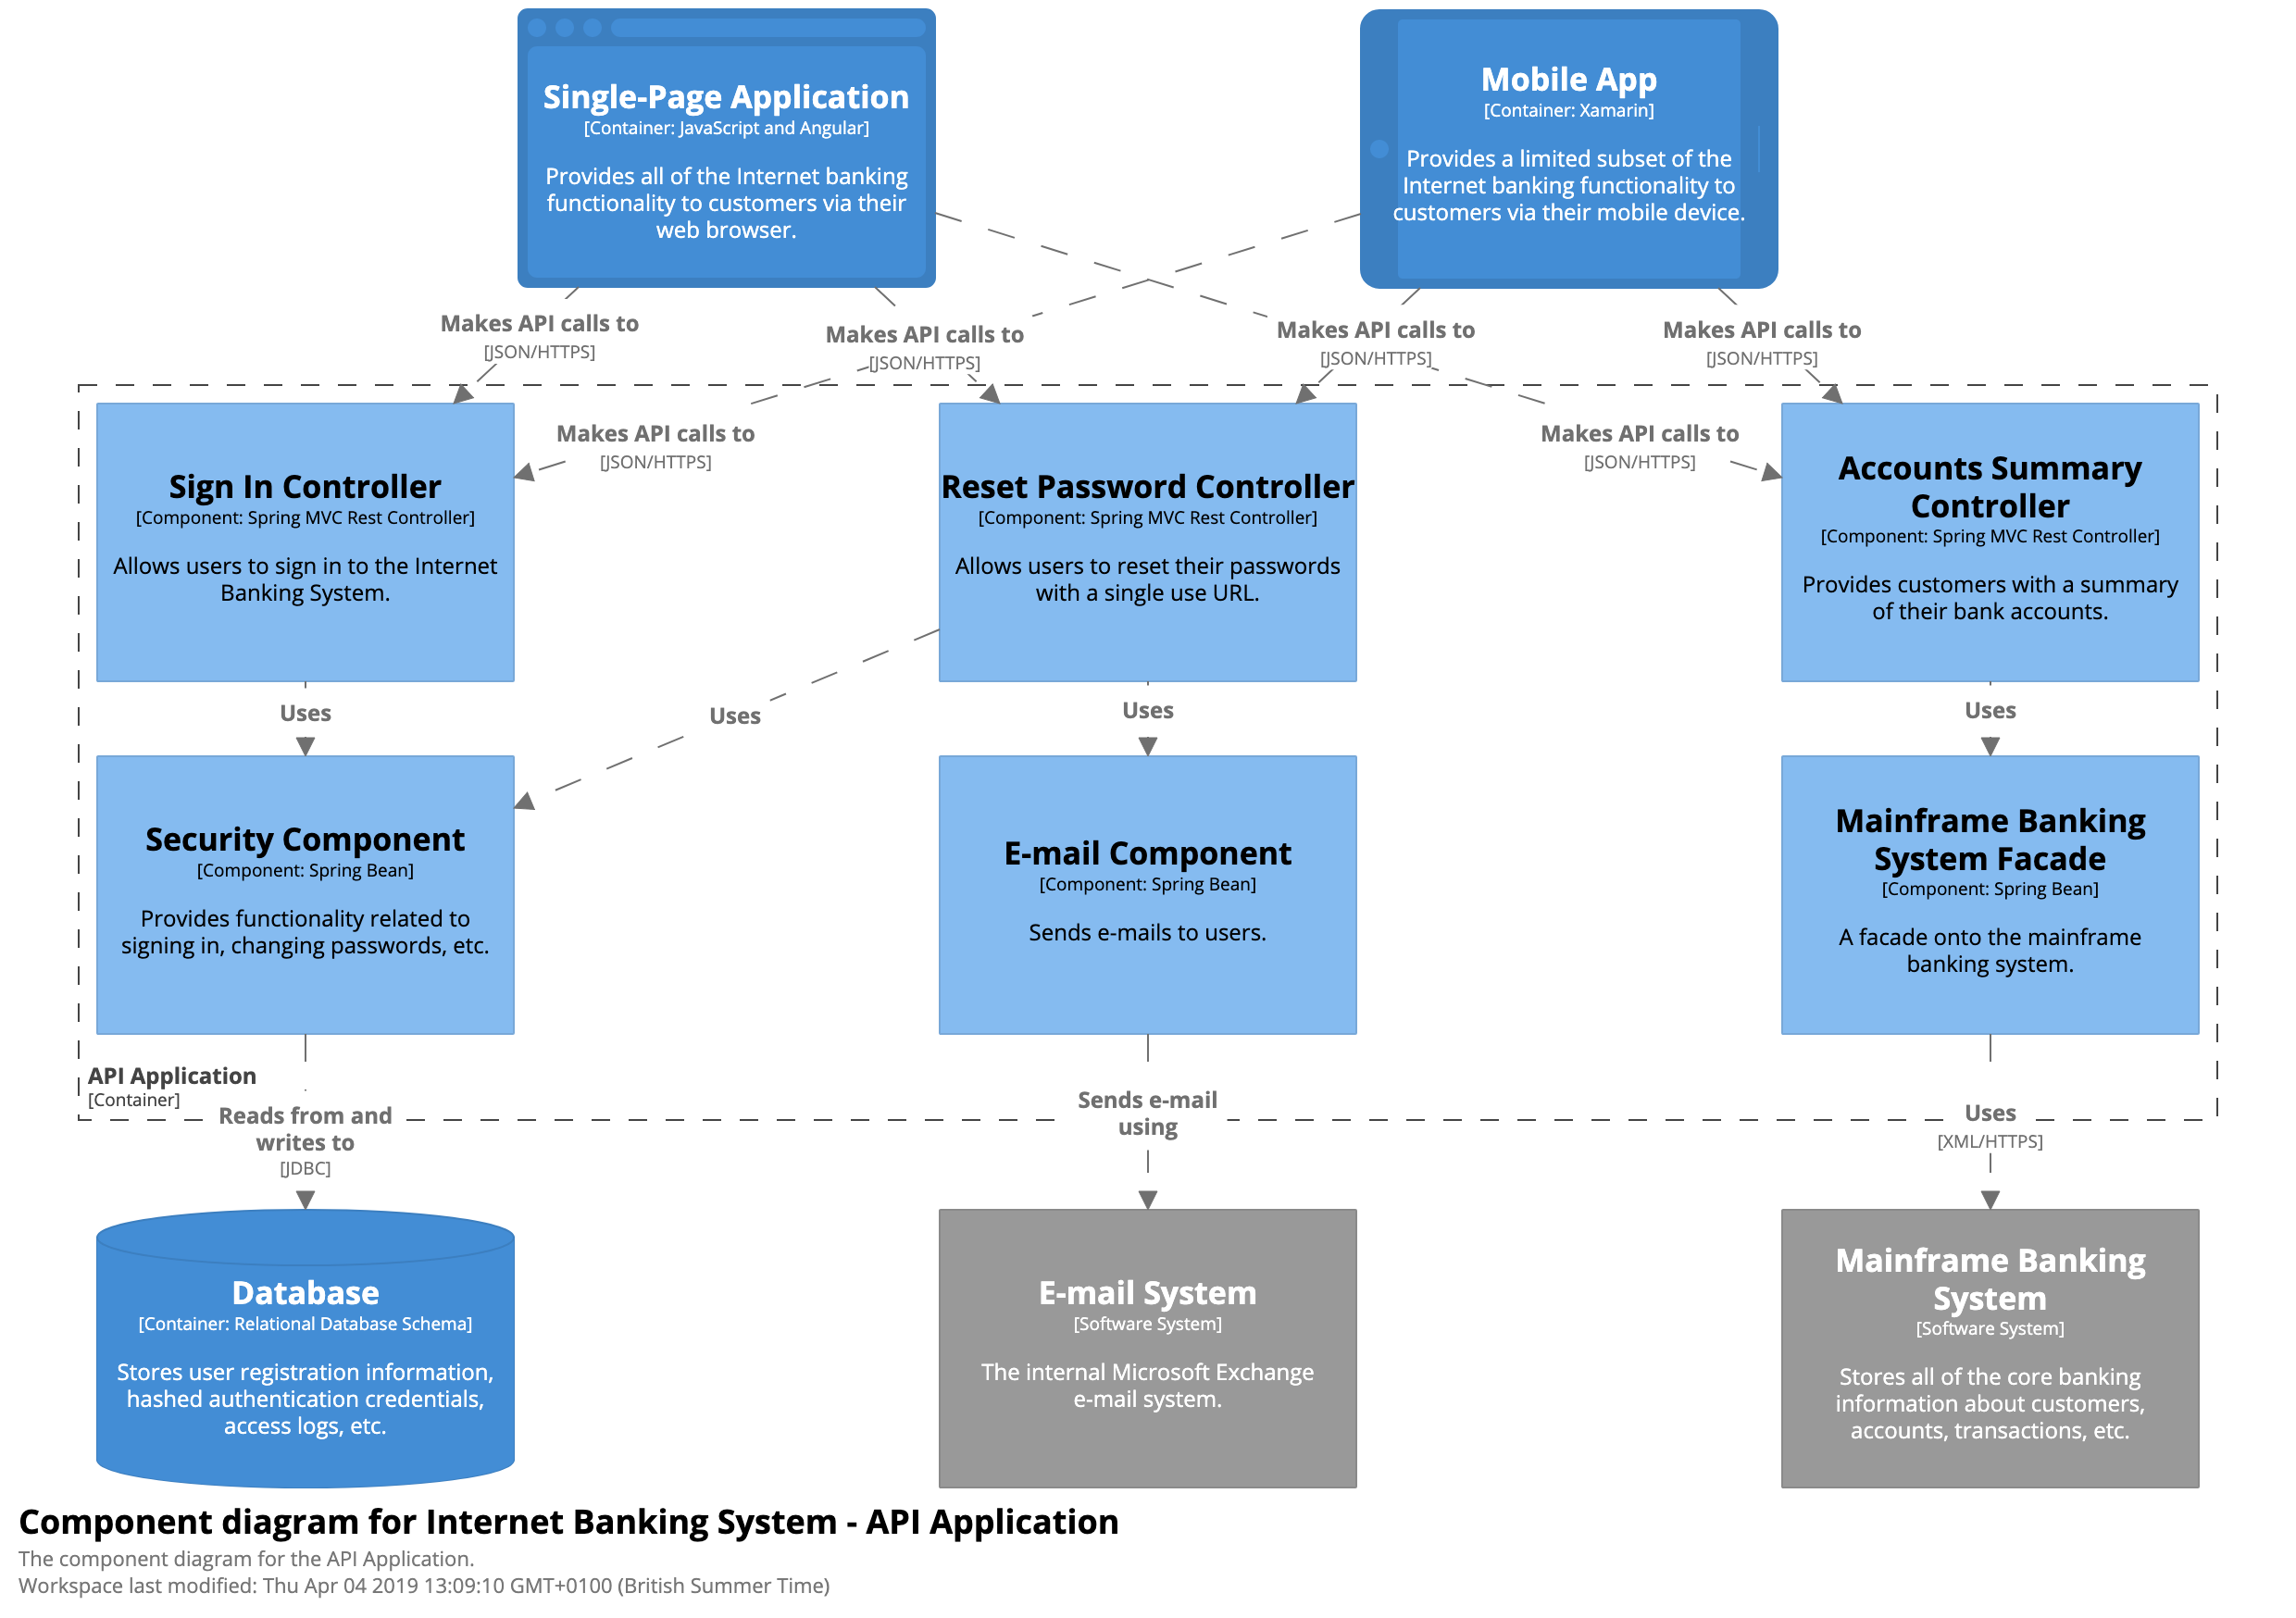
Level 1: System Context diagram
- big picture
- shows system surrounded by its users and other systems that it interacts with
- no technologies, protocols, ...
- intended audience: both technical and non-technical people, inside and outside the development team
- likely to change very slowly
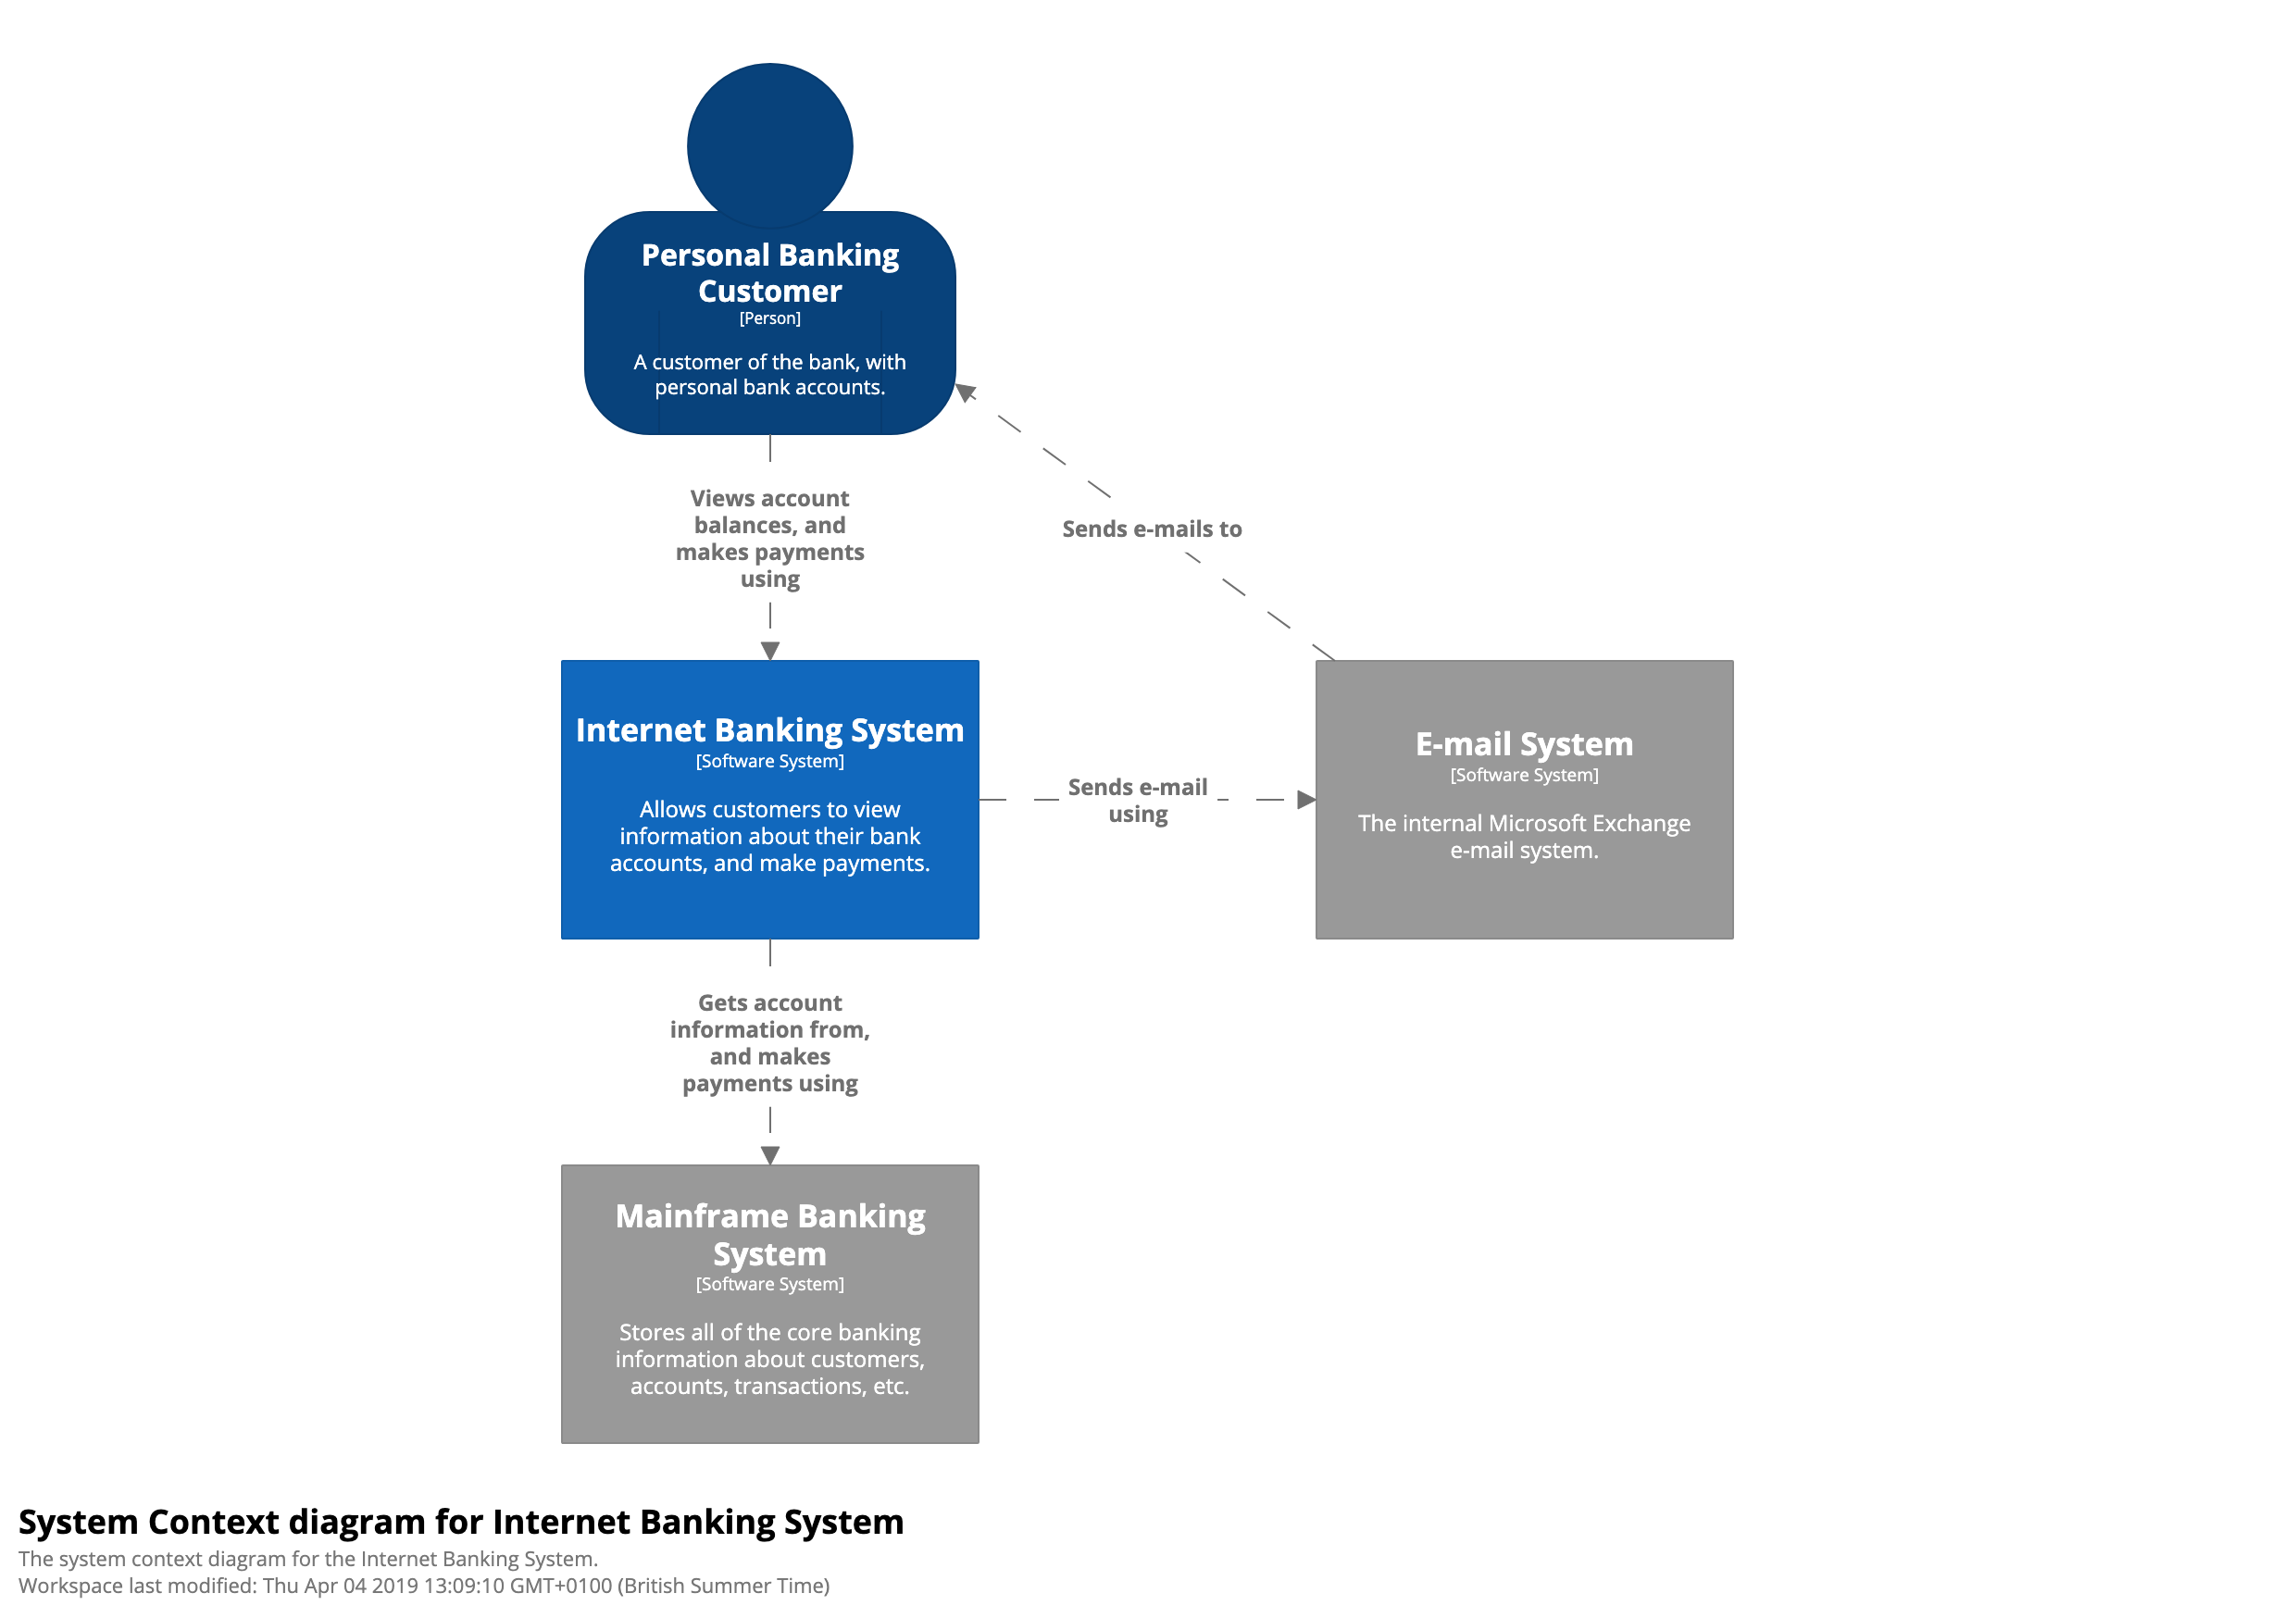
Level 2: Container diagram
- zoom in on system to show containers
- shows high-level shape of the software architecture
- shows major technology choices and how the containers communicate with each other
- intended audience: technical people, both inside the development team and outside the development team (for example, operations/support)
- likely to change very slowly
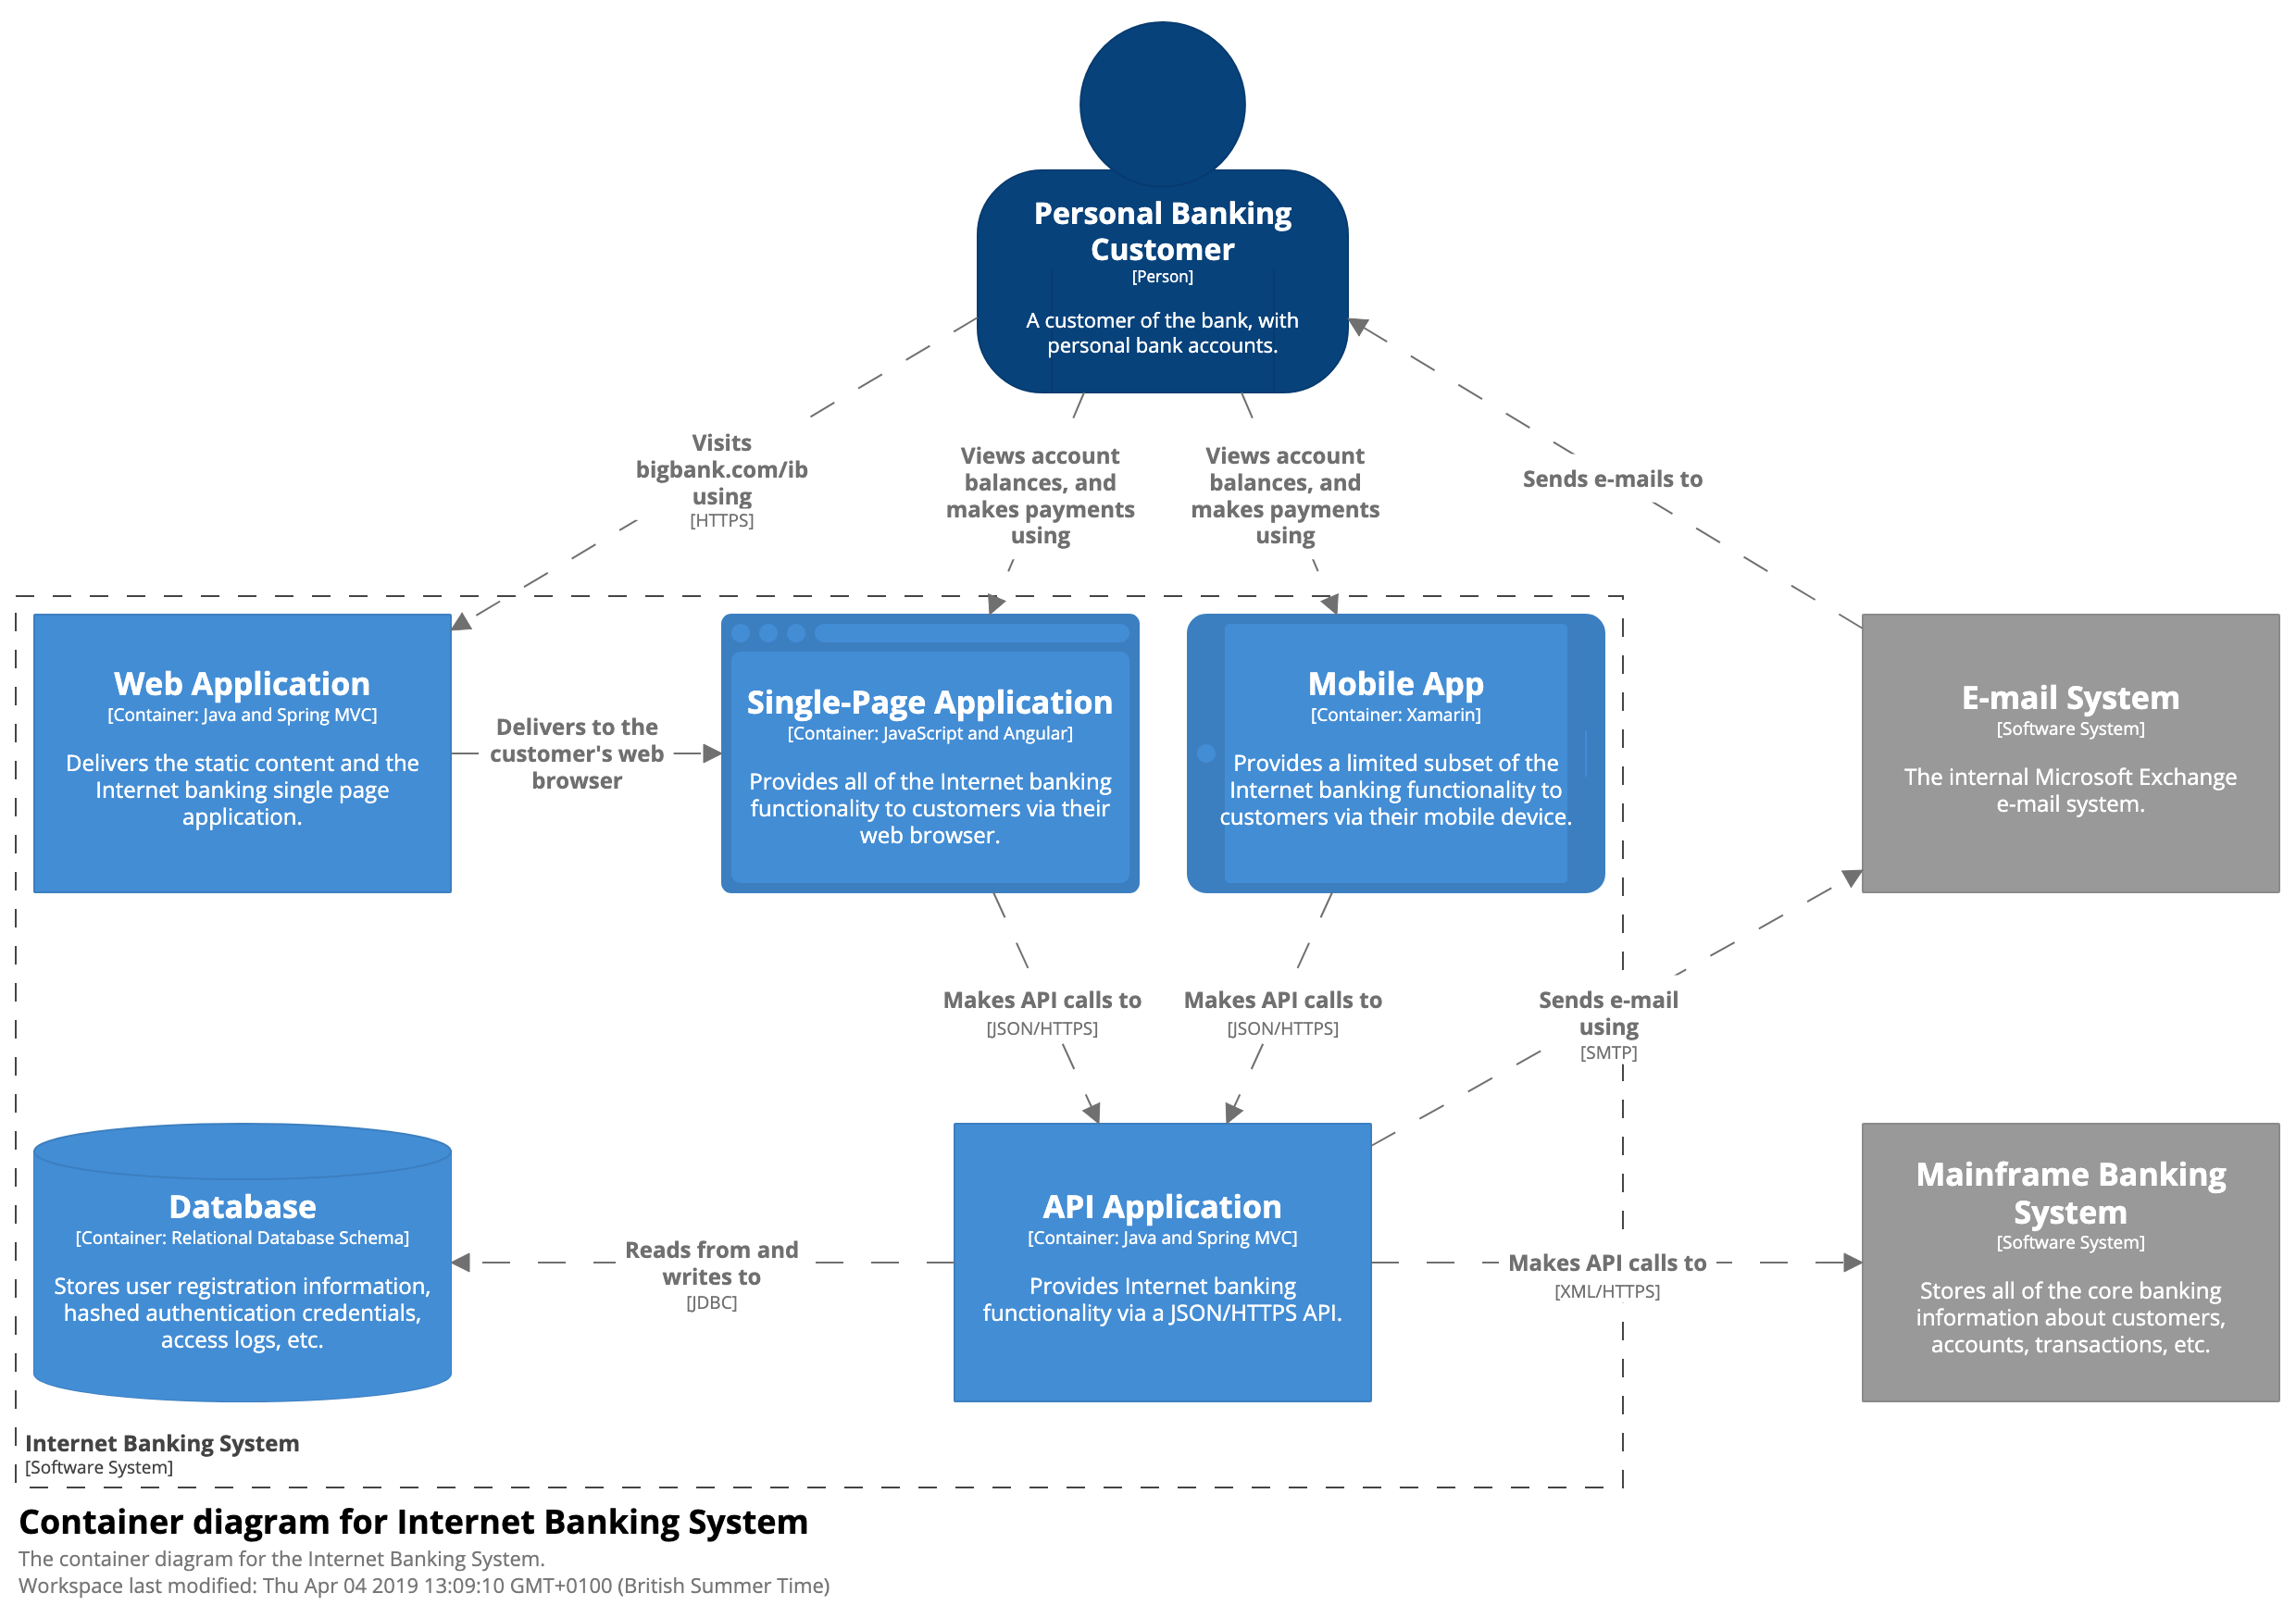
Level 3: Component diagram
- zoom in on container to show components
- intended audience: software architects and developers
- may change frequently as the team adds, removes or restructures the code into cohesive components
- generation through automated tooling can help
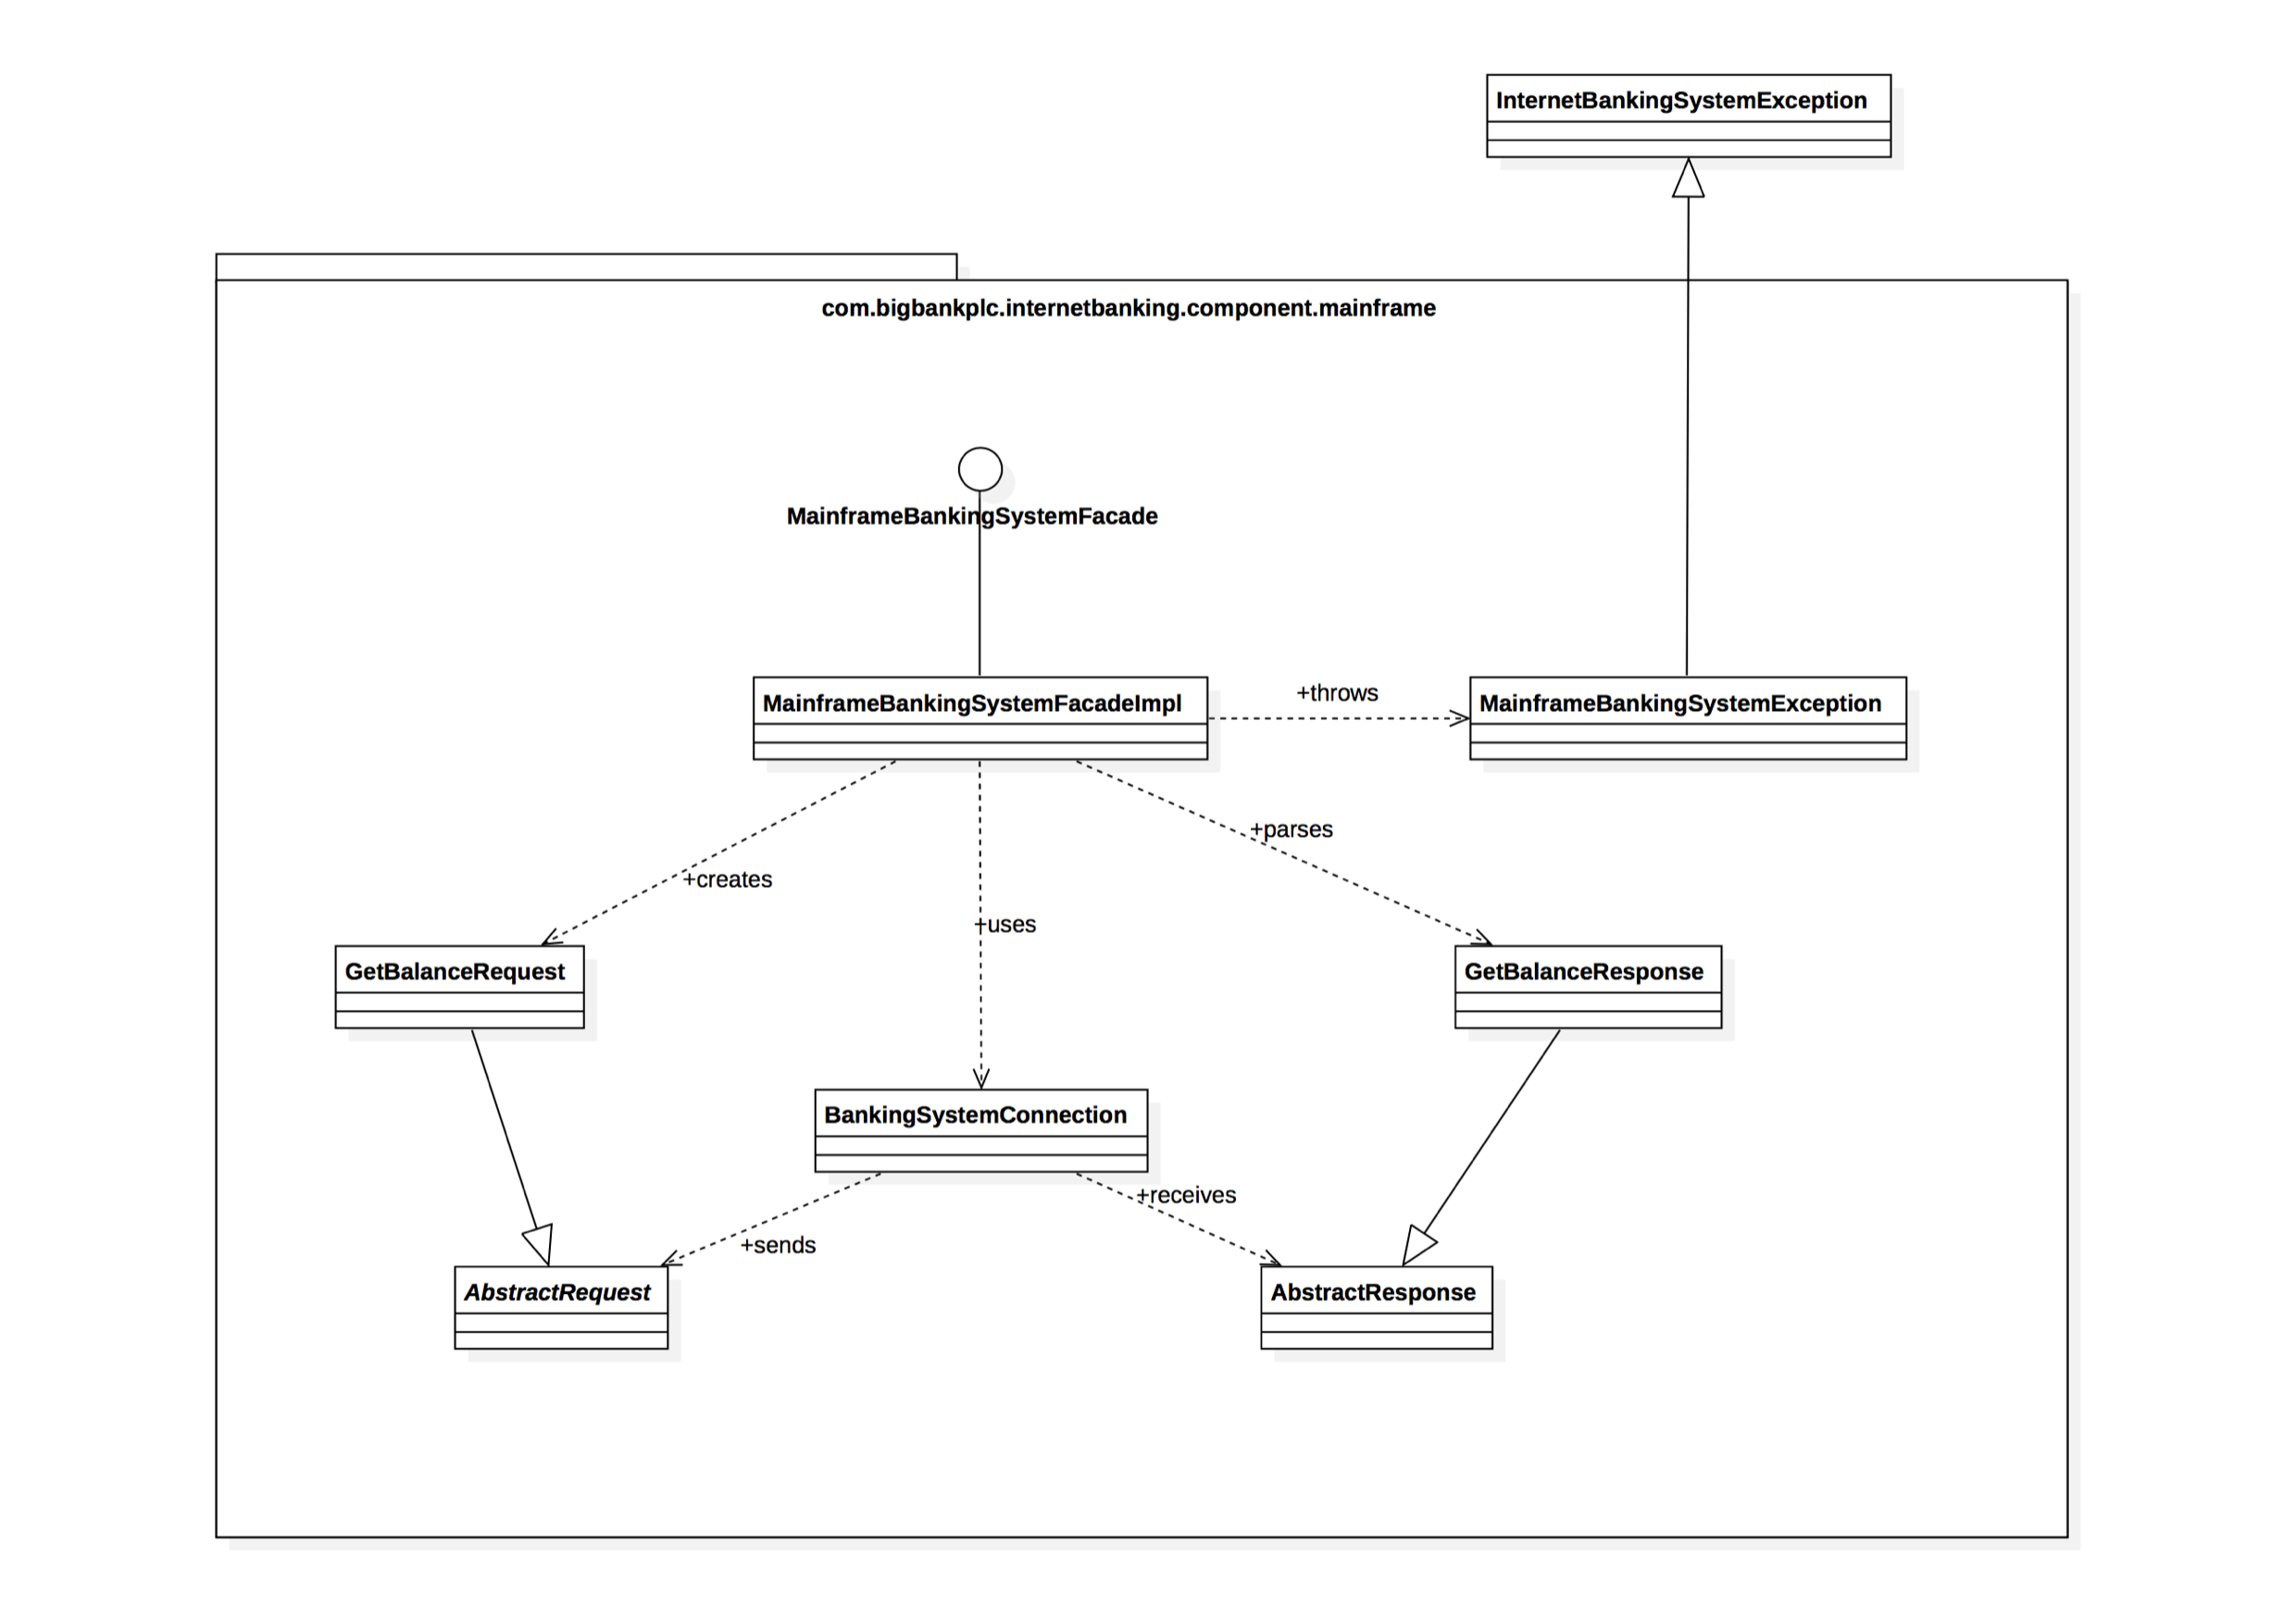
Level 4: Code
- zoom in on component to show classes, interfaces, ...
- lowest level of detail, not recommended for anything but the most important or complex components
- intended audience: software architects and developers
- will likely become outdated very quickly if the codebase is under active development
- if you generate it, generate it automatically, perhaps only on demand
Supplementary diagrams
Diagrams that can be useful to show other aspects than the core diagrams
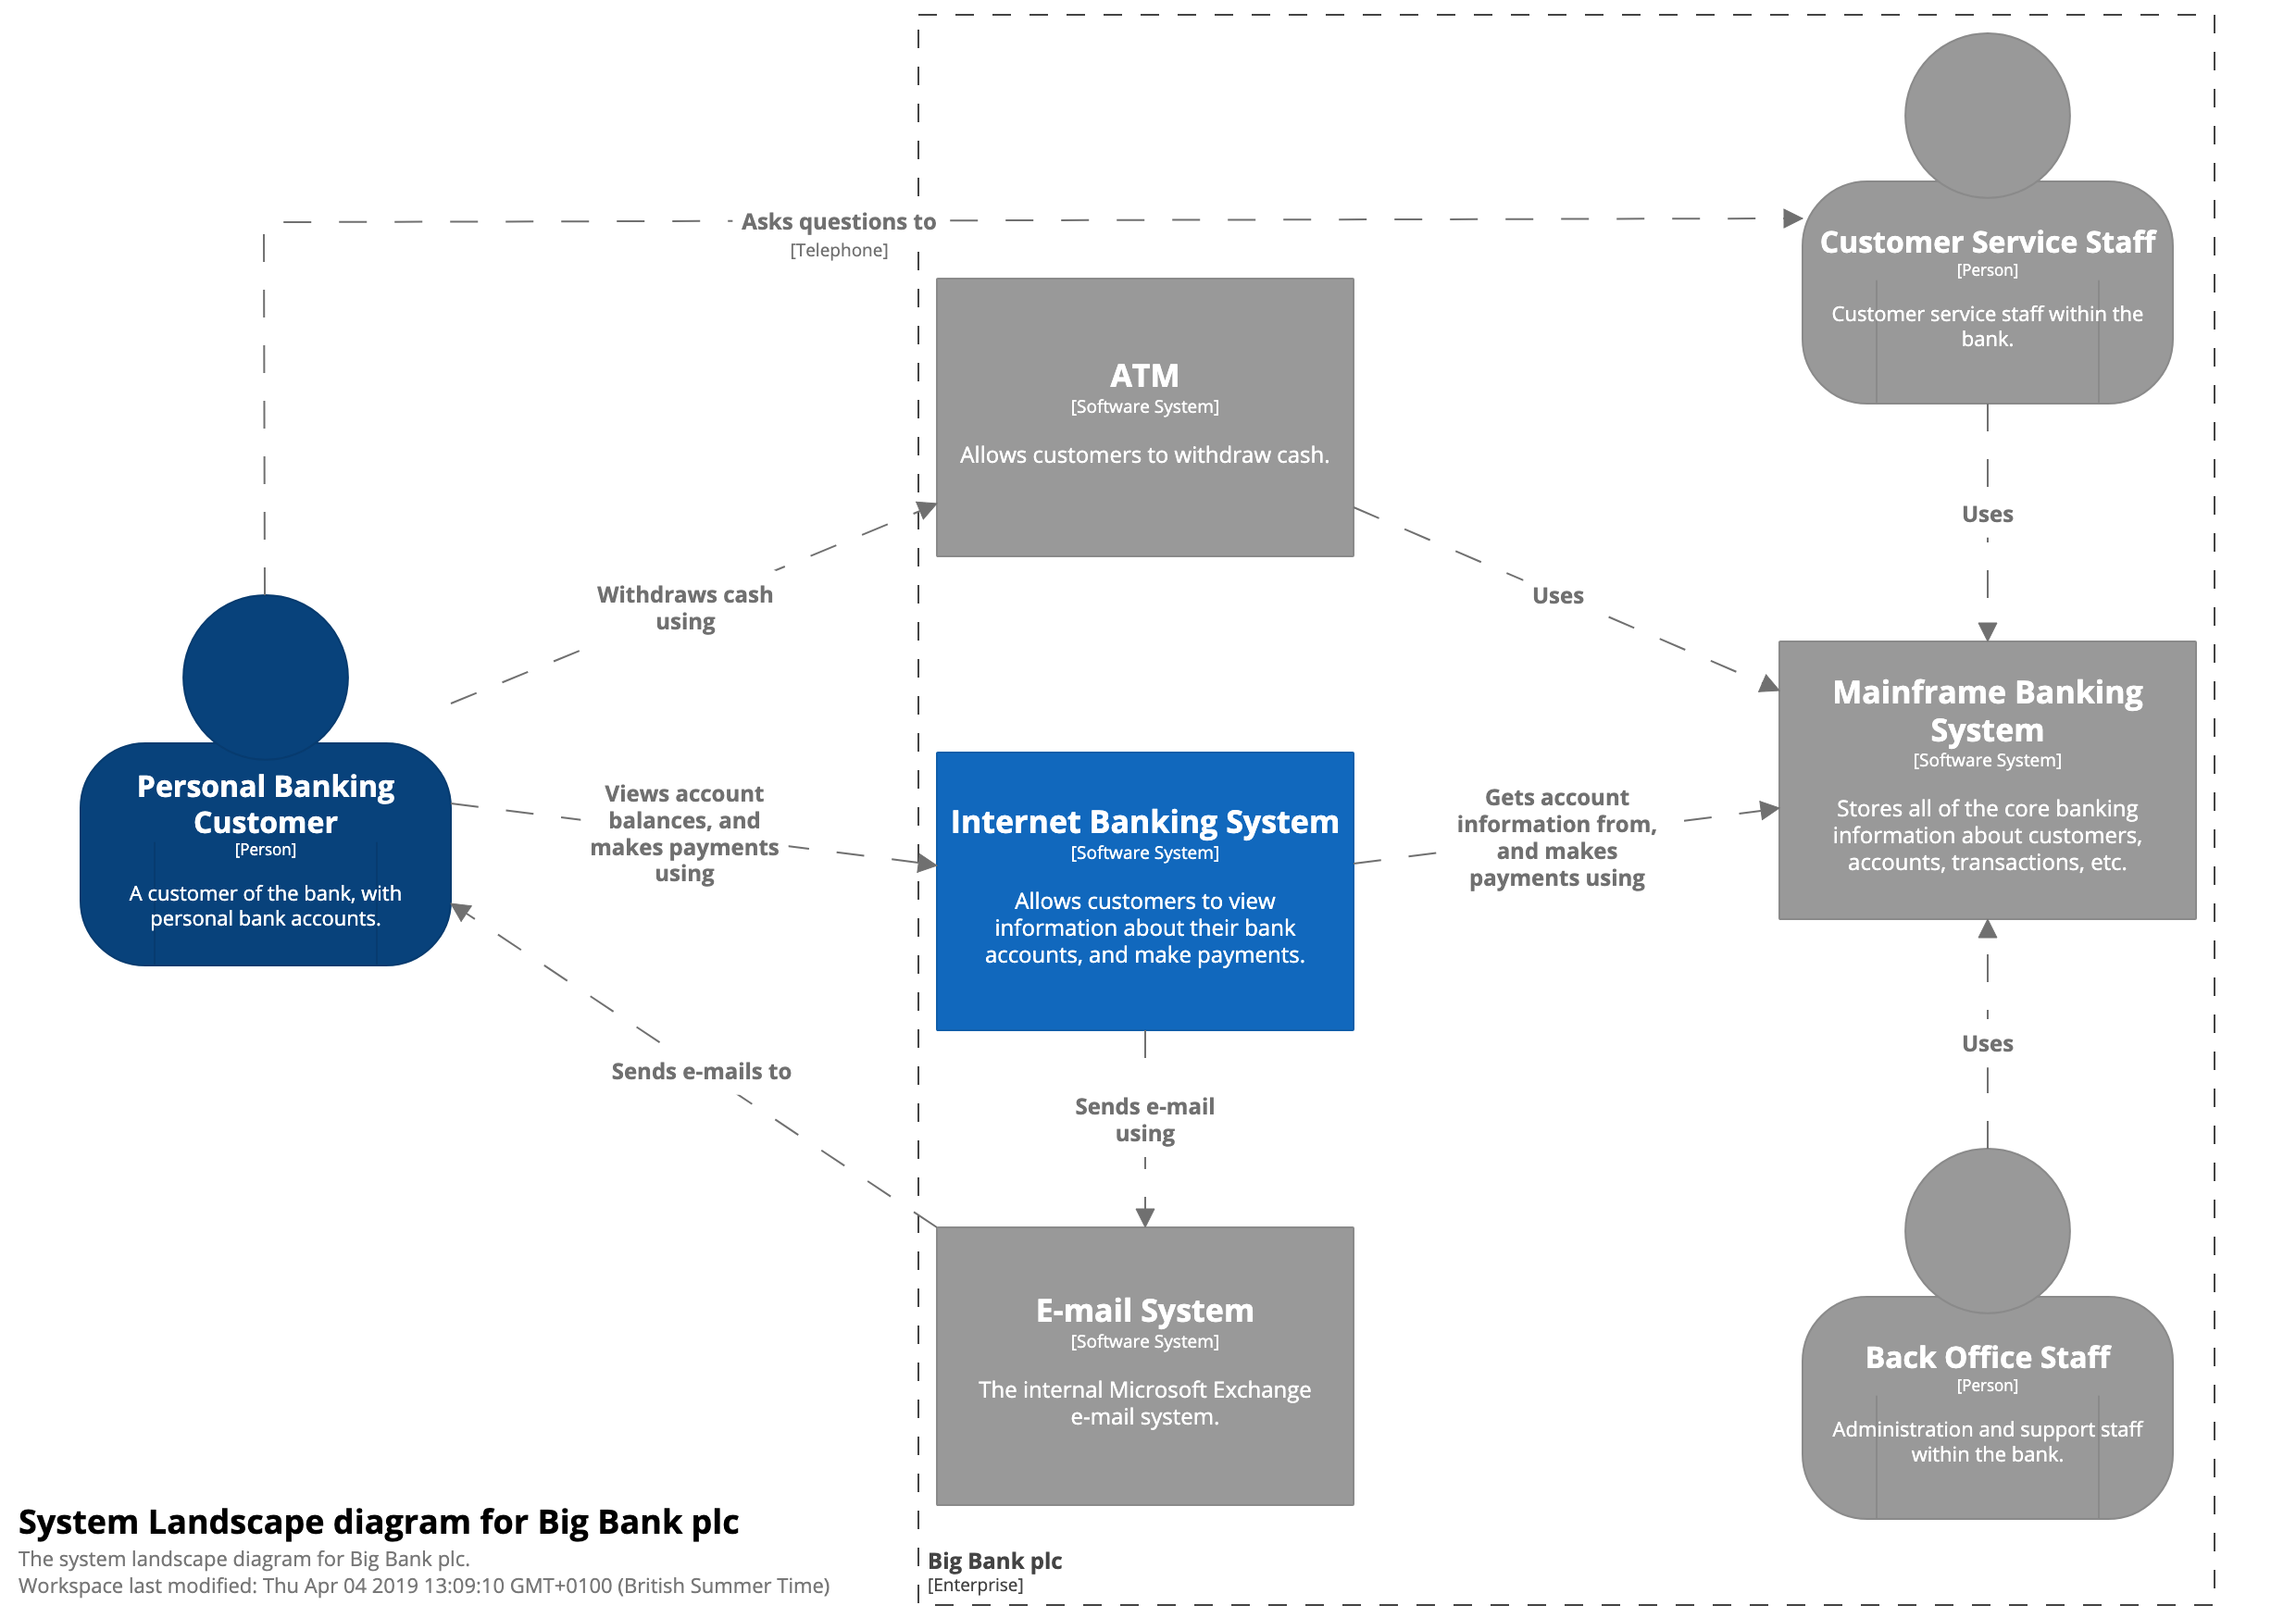
System Landscape diagram
- basically just a system context diagram without a specific focus on a particular software system
- helps if you are responsible for a collection of systems
- intended audience: both technical and non-technical people, inside and outside the development team
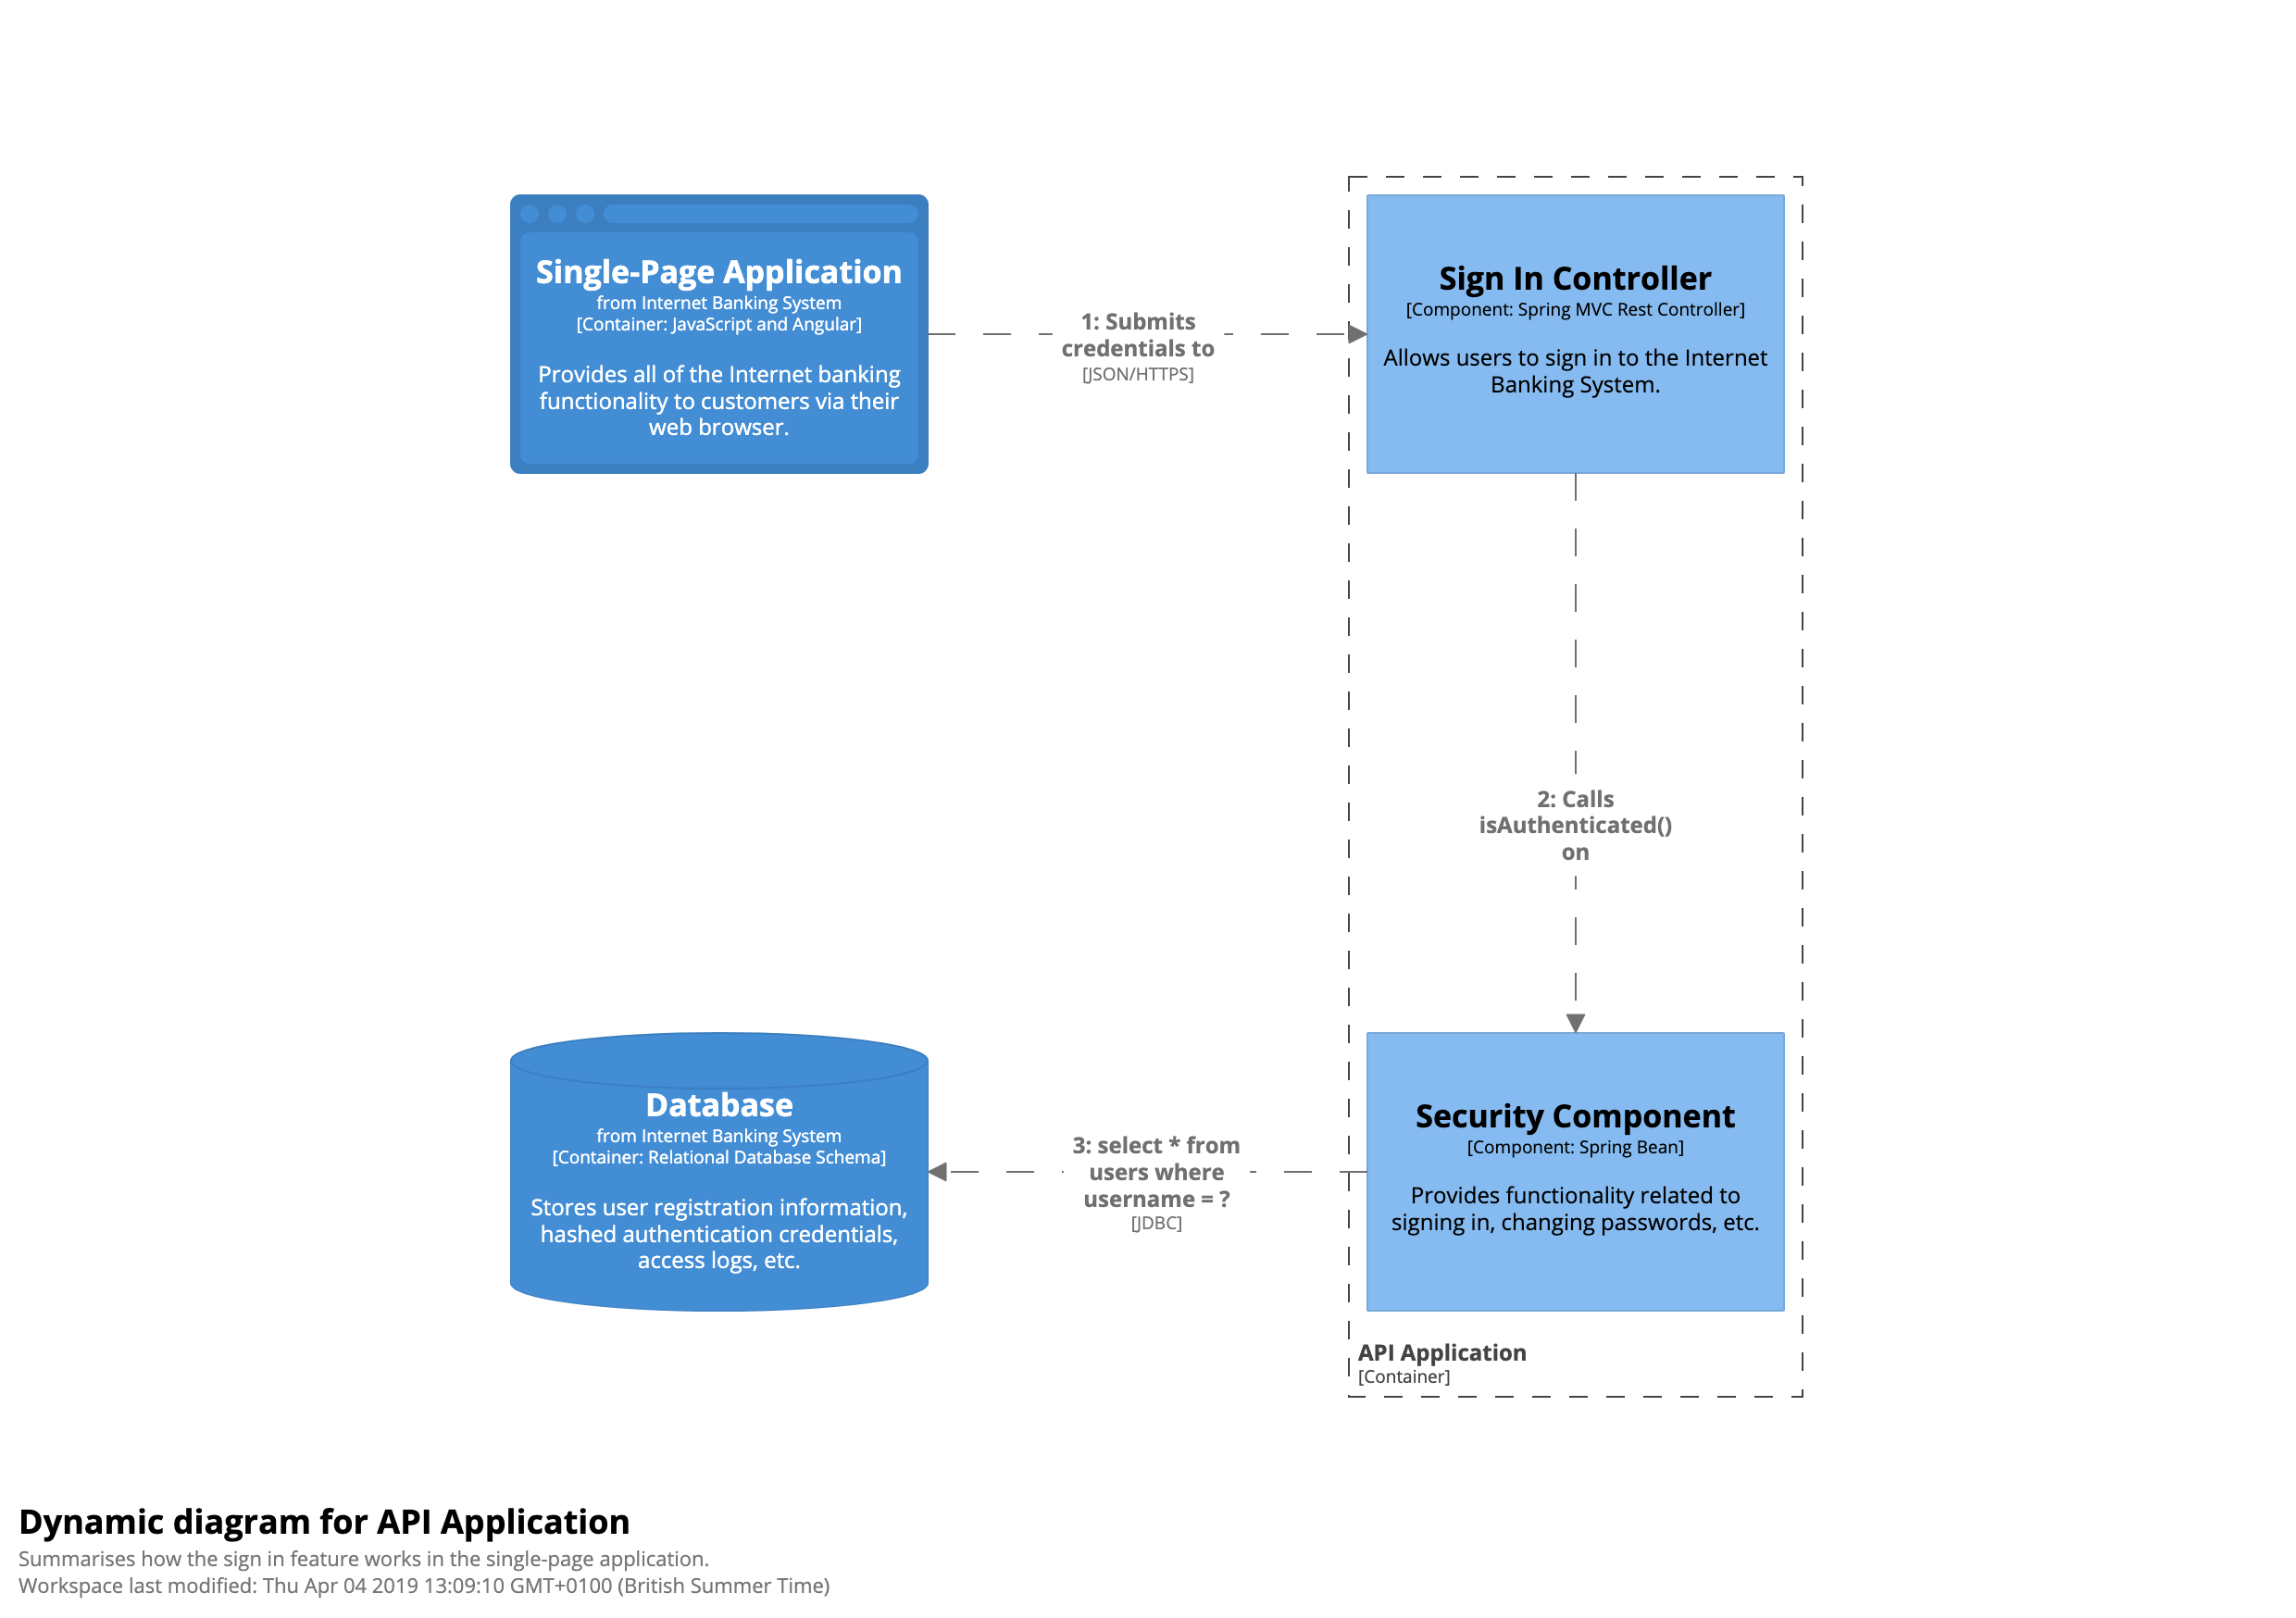
Dynamic diagram
- describes flow through the system for a specific user story, use case, feature, ...
- similar to UML UML communication diagram and UML sequence diagram
- intended audience: both technical and non-technical people, inside and outside the development team
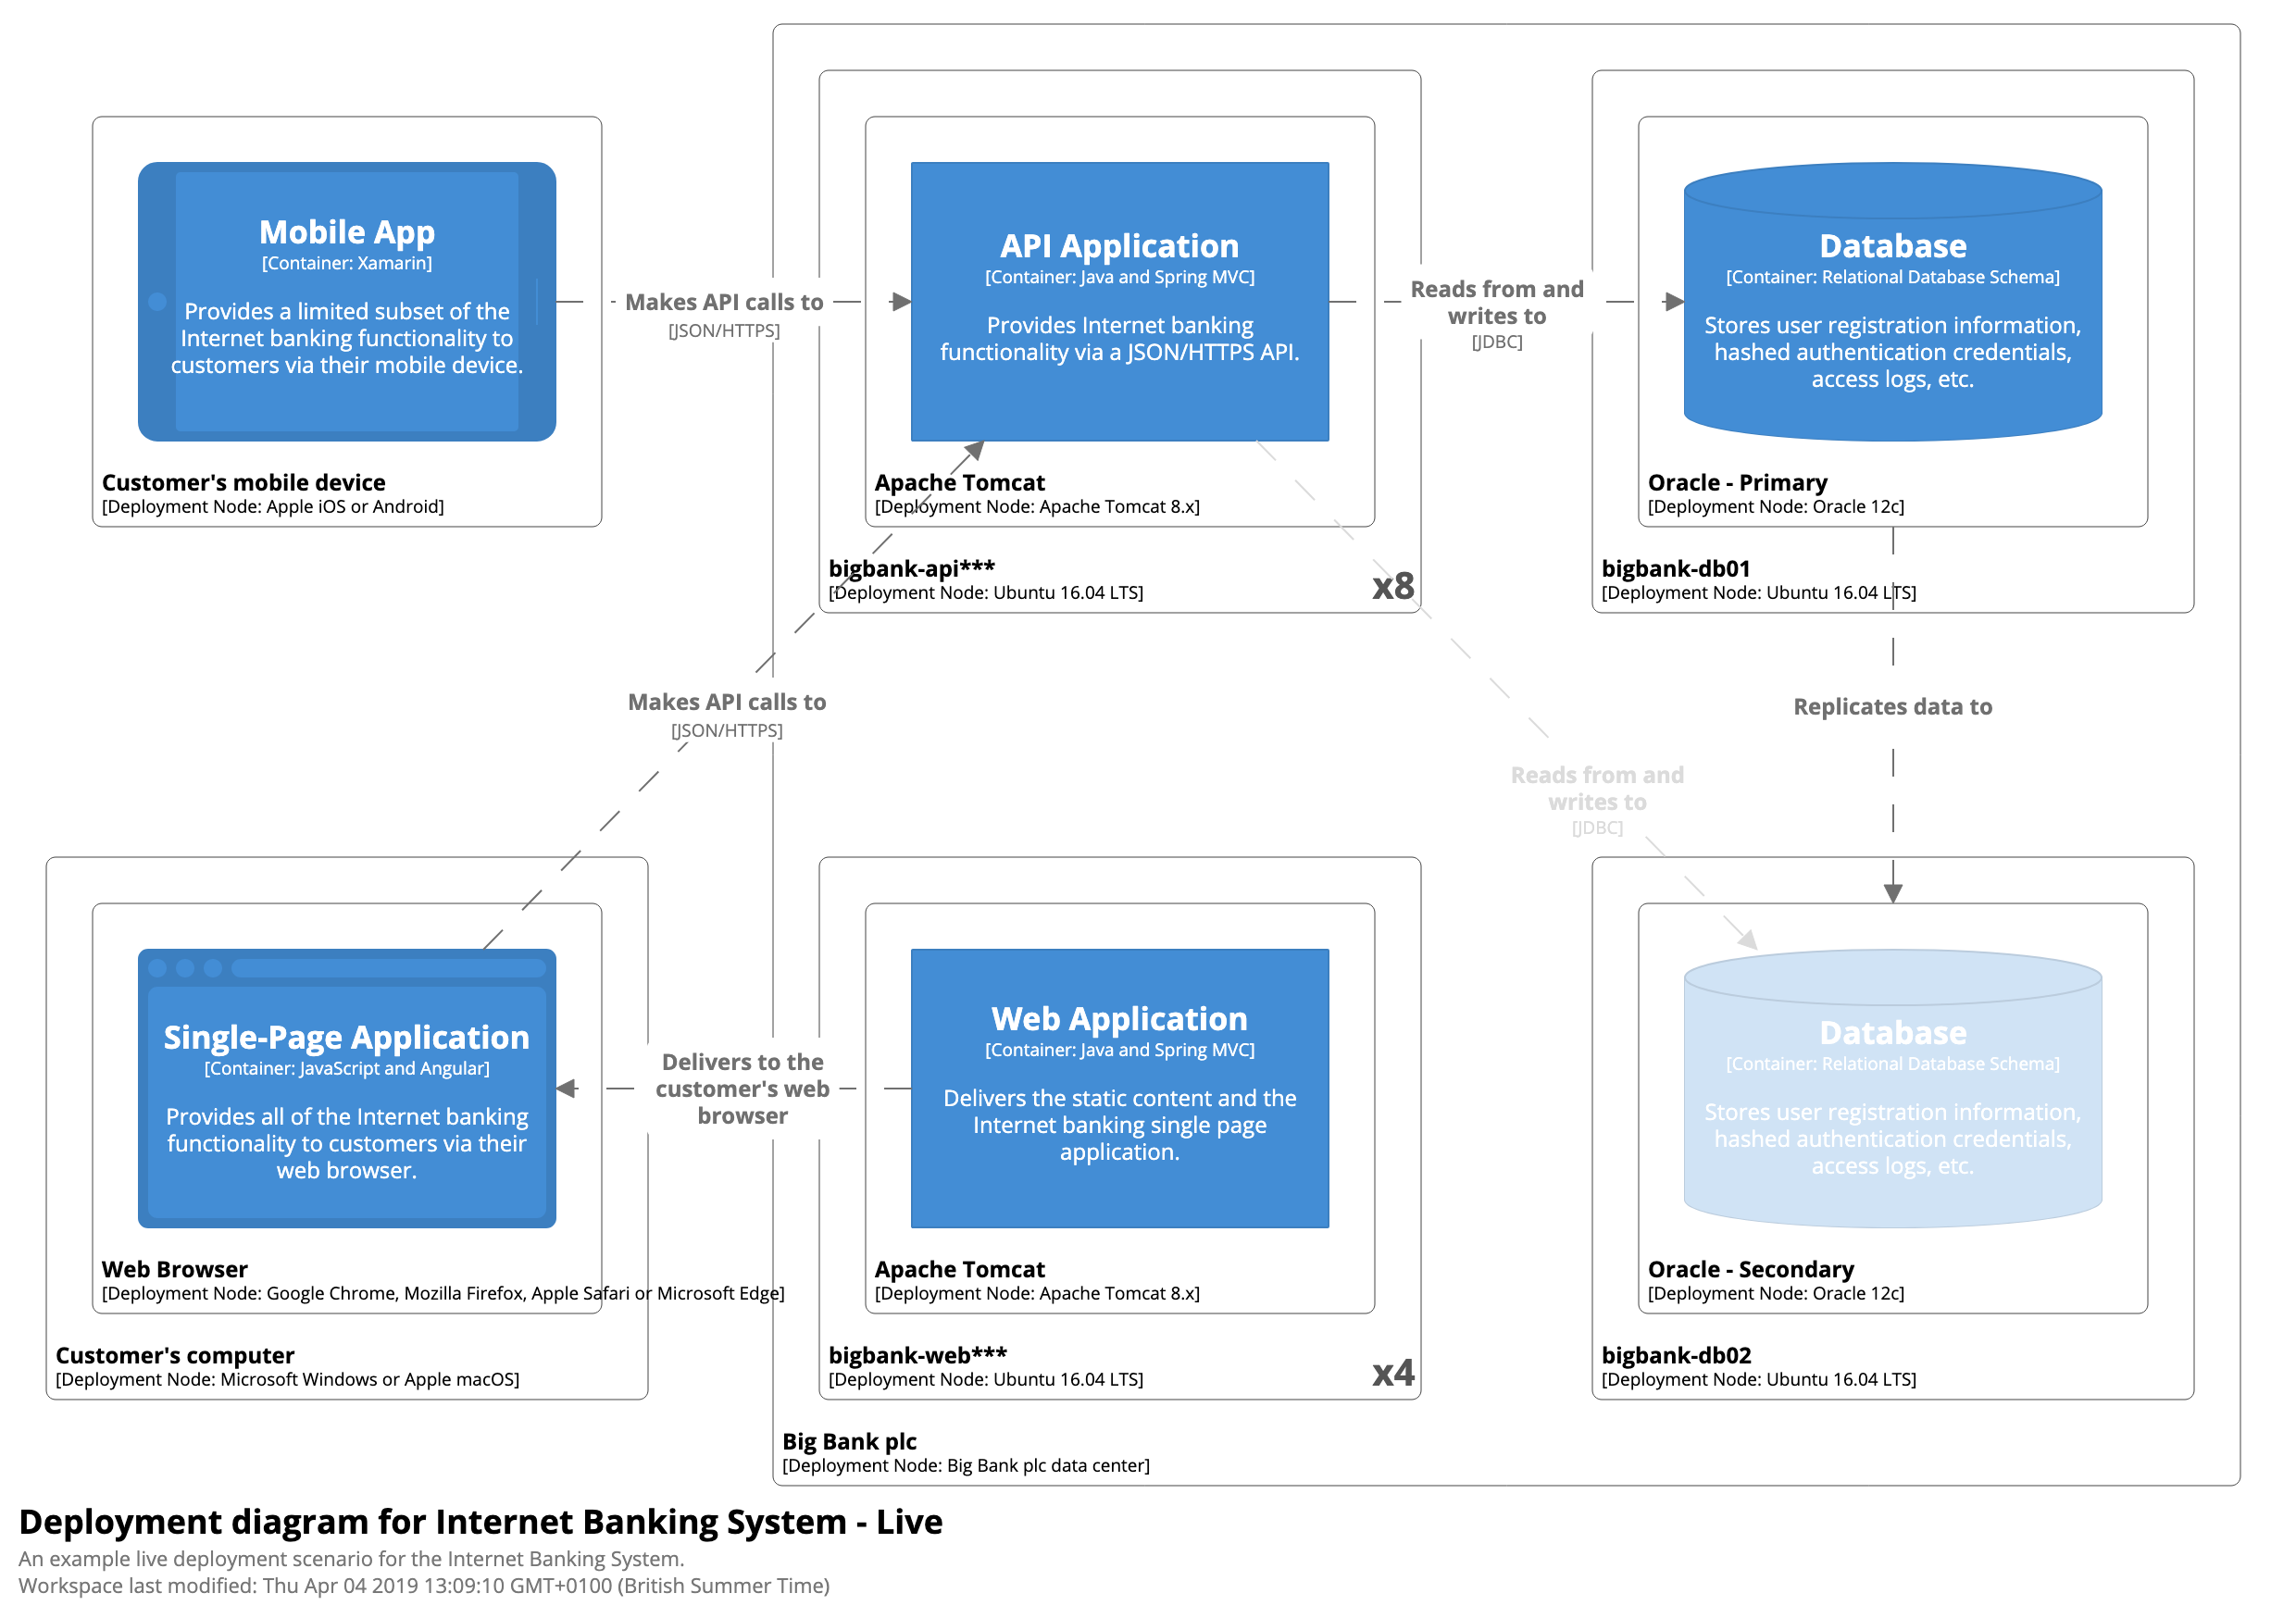
Deployment diagram
- illustrates how containers in the static model are mapped to infrastructure
- simplified version of UML deployment diagram
- intended audience: technical people, both inside the development team and outside the development team (for example, operations/support)
Some details
- diagramming large and complex software systems
- trying to show all components in the web application on a single diagram may make the diagram too large and the cognitive load too high
- consider splitting up a singe complex diagram into several simpler diagrams, each at the same level of abstraction, that each focus on a certain area (technical area, functional area, use case, ...) of the system
- modeling microservices
- if other microservices are outside of your control, model them as "black box" external software systems
- if microservices part of a system your are building (you own the services), model them as containers, along with any data stores they use
- modeling communication in message-driven architecture
- option: draw as communication to bus and communication from bus
- drawback: hides the coupling between producer and consumer of the message
- option: omit message message bus and draw communication as going directly from producer to consumer (but potentially with different color, line style, ... to show that it happens via the bus
- option: draw as communication to bus and communication from bus
- modeling Java JAR, C# assembly, DLL, ...
- typically purely organizational
- typically not a container
- potentially a component, depending how things are set up
- a JAR file might be a component
- a JAR fie might contain several components
- a single component could also be implemented using code from several JAR files!
- likely to be neither a container nor a component!